Welcome back to another update on my 2022 crypto portfolio ETF. I usually wait until the month has closed so that I have all the data available. I think today’s post is interesting because of the wild wings in February, with the war and invasion of Ukraine affecting the markets, as I covered in my last update.
Also, in the end, you can find more information about the Jupyter notebook I used to retrieve the data and generate the graphs for this post.
Disclaimers
As always, let me remind you that I am not an investment advisor and all I write here is for entertainment and to share my experiences. Nothing here is investment advice.
Crypto Portfolio Price Performance
All in all, March has been a good month for this mini ETF portfolio when compared to February. However, the month started with the end of the rally following the invasion of Ukraine by Russia.
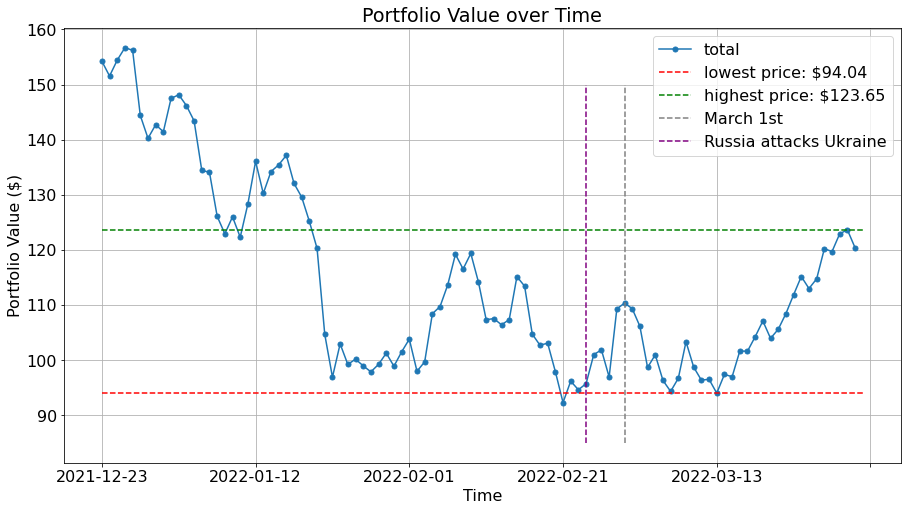
For the first two weeks, most prices kept falling until around March 13th. Since then, the prices of many cryptocurrencies in the ETF went up. I noticed this, particularly with Cardano (ADA). Here is the chart showing all price movements since the inception of the portfolio (December 23rd, 2021), and now including March.

In terms of percentages, month over month, the portfolio gained 9.08% in value. Nonetheless, the overall return since inception was -21.93% at the end of the month (it was -29.12% at the end of February). So, yes, March has been good in terms of gains. But there is a lot of room to grow to just break even.
I would say that there was less volatility than in February. Also, the lowest and highest points were both higher than last month. The portfolio’s lowest point in March was $94.04, while it reached a high of $123.65 on March 30th.
Just to visualize the movements of individual coins a bit better, here is a normalized chart of all coins:

I realize this plot does not give a lot of information right now. However, for next month I will include a chart of percentage movements instead. I think that will provide more value.
New Allocations
Here is a bar chart of the current allocations in the portfolio, compared to the initial ones. I only labeled the current allocation bars so the plot would not be too messy. In addition to that, I ordered the coins from highest allocation to lowest (based on the current allocation).

This month saw Bitcoin fall slightly below 12% and Ethereum rise just slightly. Compared to last month, the order did not change among the top 10 cryptocurrencies. The bottom 10 did not change much either, except for XLM, LTC, and ALGO.
Start Your Own Crypto Portfolio
In case you want to start your own portfolio, there are a few exchanges available. The ones I used to create this one are Coinbase Pro for most of the coins, and Binance US for BNB. If you use my referral link for Coinbase Pro, you may get $10 in Bitcoin after making a $100 transaction (you should double-check).
Additionally, I wrote a blog post on several crypto exchanges with good sign-up bonuses, which might be of interest.
Final Thoughts and Next Steps
To summarize the post, the portfolio had a monthly gain of 9.08%, while the overall return was at -21.93% by the end of March. This month has seen a bit less volatility and more optimism in general in crypto markets. I hope this trend continues so that the portfolio can break even eventually.
For the next update, I want to include a graph of the percent gains per coin, instead of the normalized chart I have been including. On top of that, I will also start sharing information about the total allocation percentage for the top 10 compared to the bottom 10 and how they change over time.
Remember that if you want to generate these charts and look at the data yourself, you can check my Github repository with all the Jupyter notebooks used today.
And if you have any comments or questions, write them below. You can also sign-up for the newsletter at this link or below to stay updated with this crypto portfolio and other projects.
