
Adding interactive plots to a Flask application can be a simple process. There are several methods to accomplish this, but today I will focus on a graphical Python library called Bokeh.
If you have been following my posts, I wrote an article about creating a Flask web app with a MySQL database in the background. You can take a look at that post if you are interested in adding a database to your application.
Installing Libraries
The main packages we are going to be using for this tutorial are Bokeh and Flask. However, there are some other packages that need to be installed. You can find an environment.yml file in the repository to install all requirements with Conda.
- Flask: server and API development
- Flask-bootstrap: for styling and visual aspects
- Bokeh: interactive plots
- cbpro: for historic data prices
- pandas: manipulating the data
Creating the Conda Environment
if you want to replicate the environment I have, use the environment.yml from the repository and in a terminal type:
conda env create -f environment.yml
Of course, the command above assumes you already have Conda installed on your system.
On the other hand, if you want to install everything by hand, here are the commands I used:
conda create -n interactive_plots \
                       python=3.9 \
                       pandas \
                       flask \
                       bokeh::bokeh=2.4.2 \
                       conda-forge::flask-bootstrap
With the above command, we created a virtual environment called interactive_plots and installed Python 3.9 along with several needed packages. The “::” forces Conda to use a particular channel to source the installation.
Pay attention to the Bokeh version you are installing. You will need it later.
After running the Conda command, you should activate it:
conda activate interactive_plots
and install the final library needed, cbpro:
pip install cbpro
Flask App
The starting point for the program is the Python module app.py. It contains the setup for Flask and it calls the necessary functions to generate the charts. The only thing this web app does is retrieve historic daily candles for Bitcoin from Coinbase.
The flask app for this mini-project is fairly simple. There is only one route to /home. Here is the part of interest:
@app.route('/', methods=['GET'])
def home():
    #-- get btc data
    trading_pair = 'BTC-USD'
    df_prices = get_price_history(pair=trading_pair)

    script,div = create_figure_and_get_components(df_prices, trading_pair)
    kwargs = {'script': script, 'div': div}
    kwargs['trading_pair'] = trading_pair

    return render_template('home.html', **kwargs)
The function create_figure_and_get_components is imported from a second module that deals with all Bokeh-related operations.
Plotting Module
You can find all the plotting functions in plotting.py and you should take a look at the repository for the full code. I’m going to show how to create a basic Bokeh plot, but remember that Bokeh allows for several types of customizations. However, a basic bokeh plot would be created in this way:
from bokeh.plotting import figure
from bokeh.models import ColumnDataSource

plot_fig = figure(
        title="Some Title",
        x_axis_type="datetime",    #in our case we have a datetime x-axis
        width=1000,
        height=600,
)

#-- define data source
source = ColumnDataSource(data=df)

#-- plot data
data_line = plot_fig.line(x="date", y="price", source=source)
Adding Interactivity With Hovertools
With the code above you would be able to create a basic plot that allows you to zoom in or out, and pan around. However, Bokeh can do a lot more. In this tutorial, I’m only covering the tip of the iceberg in terms of functionality.
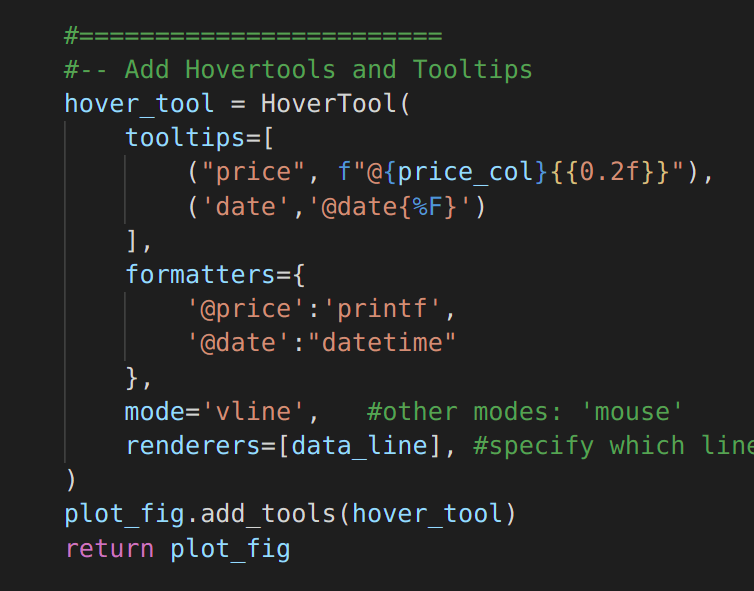
Since I’m plotting the price of Bitcoin over a time period, I want to display that value when I hover the mouse on top of it. To add that kind of interactivity, I use Bokeh’s HoverTool class.
hover_tool = HoverTool(
    tooltips=[
        ("price", f"@{price_col}{{0.2f}}"),   #escaping the {%0.2f} braces
        ('date','@date{%F}')
    ],
    formatters={
        '@price':'printf',
        '@date':"datetime"
    },
    mode='vline',   #other modes: 'mouse'
    renderers=[data_line], #specify which lines this hovertool works with
)
The result of adding the hovertool specified above would be this:

I took the screenshot as my mouse was hovering on the November 29th, 2021 mark. The price of Bitcoin at the time was almost $58k. That little card showing next to the price line is created thanks to hovertools.
Tooltips
Now let’s take a look back at the hovertool code. We define “tooltips”, as a list of the pieces of data we want to show when hovering on the chart, and “formatters” as a list of formatting specifications for the data. Here, the tooltips I defined were:
tooltips=[
    ("price", f"@{price_col}{{0.2f}}"),   #escaping the {%0.2f} braces
    ('date','@date{%F}')
]
First, we indicate the label for that data. This is what will show on the chart as text. Then we specify which data to show by using “@”. It should be a column in the data source the chart is reading from (a column in a pandas dataframe, for example).
We can also specify some formatting options by enclosing them in curly braces. For the price data, we are indicating we want to show the value up to 2 decimal figures.
In the code, I’m using an f-string so that I can easily change the column name later. This means I have to remember to scape the formatting curly braces. Bokeh expects to see them. That’s why I write “{{0.2f}}” instead of simply “{0.2f}”.
Other Hovertool Parameters
The final sections of the hovertool definition specifies the “mode” and the “renderers”. With mode=”vline”, the hovertool card will show up no matter if the mouse is directly over the line. As long as it is in its vertical range, it will be displayed.
The “renderers” parameter just tells Bokeh which data line these tooltips should apply to. In the particular chart I shared above, there are 4 lines: the price line (blue), the max price line (purple), the minimum price line (red), and the average price line (green). If I omit it, then there will be a floating card for each line, like the following:

Flask HTML Templates
For this project, the HTML code is very simple. This is what home.html looks like:
{% extends "bootstrap/base.html" %}
{% import "bootstrap/wtf.html" as wtf %}
{% block content %}
    <head>
        <meta charset="utf-8">
        <title>{{ title }}</title>

        <link
            href="https://cdnjs.cloudflare.com/ajax/libs/bokeh/2.2.3/bokeh.min.css"
            rel="stylesheet" type="text/css">
        <link
            href="https://cdnjs.cloudflare.com/ajax/libs/bokeh/2.2.3/bokeh-widgets.css"
            rel="stylesheet" type="text/css">
        <link
            href="https://cdnjs.cloudflare.com/ajax/libs/bokeh/2.2.3/bokeh-tables.css"
            rel="stylesheet" type="text/css">
    </head>
    <body>
        <div class="container">

            <h1>Historic Price Chart for {{trading_pair}}</h1>
            {{ div|safe }}
            {{ script|safe }}

            <p><a href="{{ url_for('home') }}">back home</a></p>
        </div>

    </body>
    <script src="https://cdnjs.cloudflare.com/ajax/libs/bokeh/2.4.2/bokeh.min.js"></script>
    <script src="https://cdnjs.cloudflare.com/ajax/libs/bokeh/2.4.2/bokeh-widgets.js"></script>
    <script src="https://cdnjs.cloudflare.com/ajax/libs/bokeh/2.4.2/bokeh-tables.js"></script>

{% endblock %}
Bootstrap takes care of many of the visual aspects of the page. Just make sure to match the version of Bokeh installed with the version requested in the HTML near the bottom of the page.
Troubleshooting Common Errors
One mistake I make all the time when combining Bokeh and Flask is forgetting to match the Bokeh library version installed in the system with the one that is imported in the HTML files. Usually this results in the Flask app loading correctly but the chart being empty.
If you use the environment.yml file that I provided, you should have version 2.4.2 installed. If you are not sure, just run the following command in the terminal (inside the Conda environment):
python -c "import bokeh; print(bokeh.__version__)"
For problems with hovertools not displaying data correctly, it is probably a formatting mistake. In that case, check the documentation for the HoverTool class and fix the issue.
Final Thoughts
Today I covered a basic use of Bokeh for a timeseries plot. I recommend checking Bokeh’s documentation for more options and examples to get started. I will be writing about creating a data dashboard with another library Panel, which uses Bokeh underneath.
And before I forget, you can find the code for this project in my Github repository. Additionally, here is another project I worked on. It uses Bokeh, as well as Flask and a MySQL database.
Let me know if you have any questions about this article or anything, and don’t forget to sign up for the email newsletter if you want to stay updated on what I post.