
Another month has gone by and I’m ready to share how my 2022 crypto portfolio is doing. If you want to read about the parameters I chose, check my initial post here.
For this month, I created a couple of Jupyter notebooks in Python to analyze the data more in-depth. You can check the notebooks and daily candle data that I’m using in my Github repository.
Disclaimers
Always remember that I’m not any type of advisor, so don’t take what I share here as financial advice. This post is simply for entertainment purposes.
What Happened to Crypto in February 2022?
February brought some new volatility to crypto and stock markets, at least in my opinion. My crypto portfolio has fluctuated significantly since the beginning of the month.
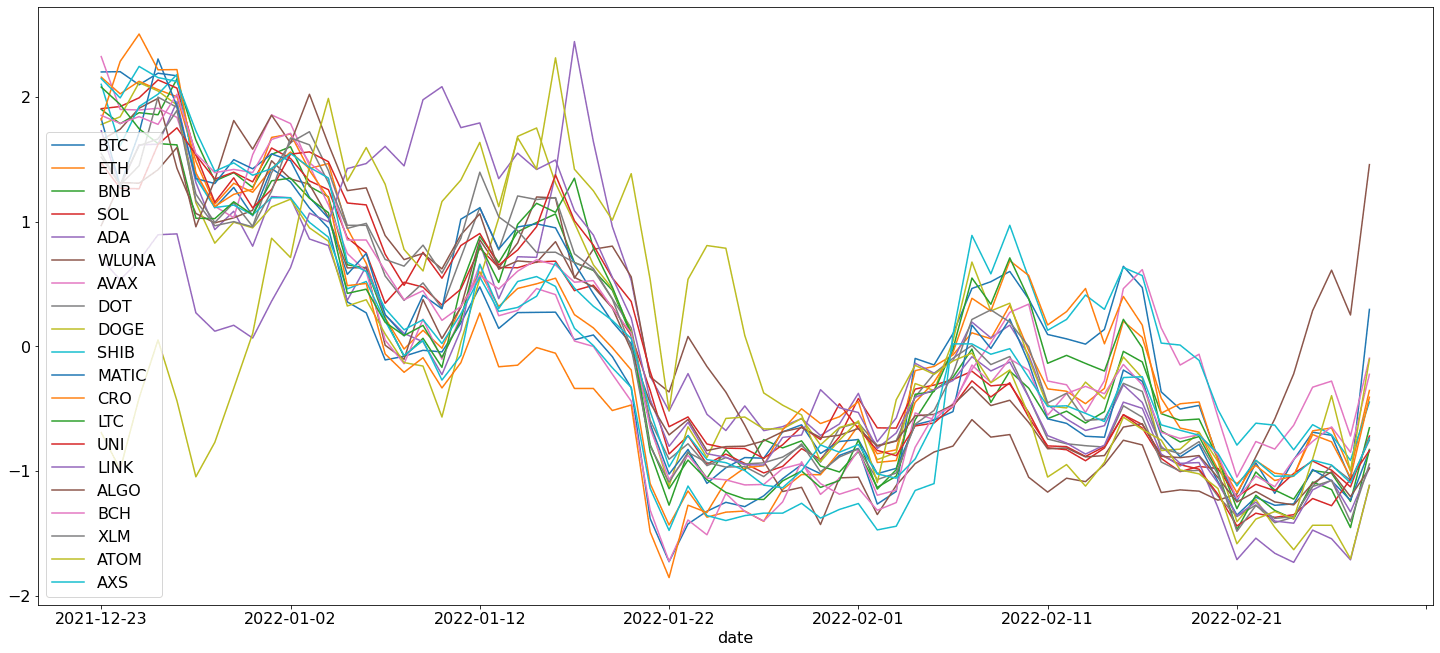
I made a chart following the price movements of the 20 coins in the portfolio. Keep in mind that the data is normalized like this: {(value – mean(value) ) / std(value)}, so that all of them fit in the same range. In the chart, February begins on the right half of the image.

I think a lot of the volatility we saw this month was due to fear and uncertainty about Russia’s actions at the border with Ukraine. In fact, what I observed with my portfolio, is that the worst days were the ones leading up to the invasion of Ukraine by Russia. However, the markets went up right after the actual attack began on February 24th.
I believe this had to do with sanctions posed by the US and Europe on Russia. Apparently, the market hates uncertainty and prefers news, even if they are not good.
Price Performance
Whatever the case for the drop was, the month closed in the green in comparison to where it started, ending on a monthly gain of +5.27%. Here is a chart showing the portfolio value since its inception and until the end of February.
In the chart, I marked a few important points, such as the beginning of February, and the start of the Russian attack.

In the chart, we can see that the portfolio started in a low place after a brutal drop throughout all of January, at a price of $103.84. About just one week later though, the portfolio reached its monthly all-time high of $119.36.
The lowest point came on February 21st, at $92.34 when Russia first invaded Ukraine. Since then, the price has been recovering.
New Portfolio Allocations
Since many of the coins have gained or lost value, I also wanted to see what the new allocation percentages look like now compared to the beginning. For that reason, I produced a bar chart to show the difference from the initial allocation to each coin compared to the state of the portfolio on February 28th.

From the chart, we can see that most of the coins remained relatively similar to their initial distribution. The only ones that changed significantly were Bitcoin (BTC), Luna (LUNA/WLUNA), and Solana (SOL).
Bitcoin remains the top coin, and it is up from just below 10% to slightly above 12%. Luna went from being in 6th position to becoming the 3rd biggest in the portfolio (Binance coin is just behind).
On the other hand, Solana’s rank dropped from 4th to 8th position (just above Dogecoin).
How to Start a Portfolio
Most of the coins in this portfolio were purchased through Coinbase (use my referral). However, there are many other exchanges that might be better suited for you, especially if you are not in the US. I covered a few of the exchanges I have used and their sign-up bonuses here.
Final Thoughts
I enjoyed using charts to illustrate the data that I collected for the past month. As a result, I will be doing this kind of approach moving forward, because I think it provides more clarity.
In terms of the portfolio, even though it had a monthly gain of 5.27%, the overall performance is less encouraging. So far, the portfolio is down 29.12% since its inception on December 23, 2021, and until the end of February.
I would like to know if anyone has suggestions for other analyses to perform on the data (also check the repository). Let me know in the comments, so I can plan ahead for next month, and remember, you can subscribe to the newsletter to stay in touch.