
The month of June has been brutal for cryptocurrencies and the stock market in general. For example, Celsius paused crypto withdrawals in mid-June, sending the markets even lower.
In this post, I want to share how my crypto portfolio performed in the month of June. At the same time, I’ll cover important events, most notably, the pause of Celsius withdrawals.
Disclaimers
As always, what I post here is simply my analysis of what happened last month. Do not take anything I write as investment advice of any kind.
Another disclaimer is that some of the links in this post might be referral links to products I use. That means that if you use them (for example to open an account on Coinbase) I might get a commission or some kind of bonus, but it comes at no extra cost to you. If you use my links, I will be grateful to you.
Celsius Pauses Withdrawals
Probably one of the biggest crypto events in June has been that Celsius paused withdrawals indefinitely. On June 12, Celsius issued a memo indicating that all withdrawals would be paused, without any timeline as to when things would go back to normal.

Many people believe this lockdown on withdrawals is a sign that Celsius is insolvent. The risk for those who deposited their coins with them is that Celsius has a clause in its terms of use that basically allows it to use customers’ deposits as its own in the event of bankruptcy. The text in question is under section 13, point 3:
In the event that Celsius becomes bankrupt, enters liquidation or is otherwise unable to repay its obligations, any Eligible Digital Assets used in the Earn Service or as collateral under the Borrow Service may not be recoverable, and you may not have any legal remedies or rights in connection with Celsius’ obligations to you other than your rights as a creditor of Celsius under any applicable laws.
Most cryptocurrencies were already falling by the time of the announcement, but the drop accelerated. Bitcoin started at just under $28,000 on June 12, but by June 18th, its price dropped to $17,600. At the time of writing, Bitcoin is at $18,700.
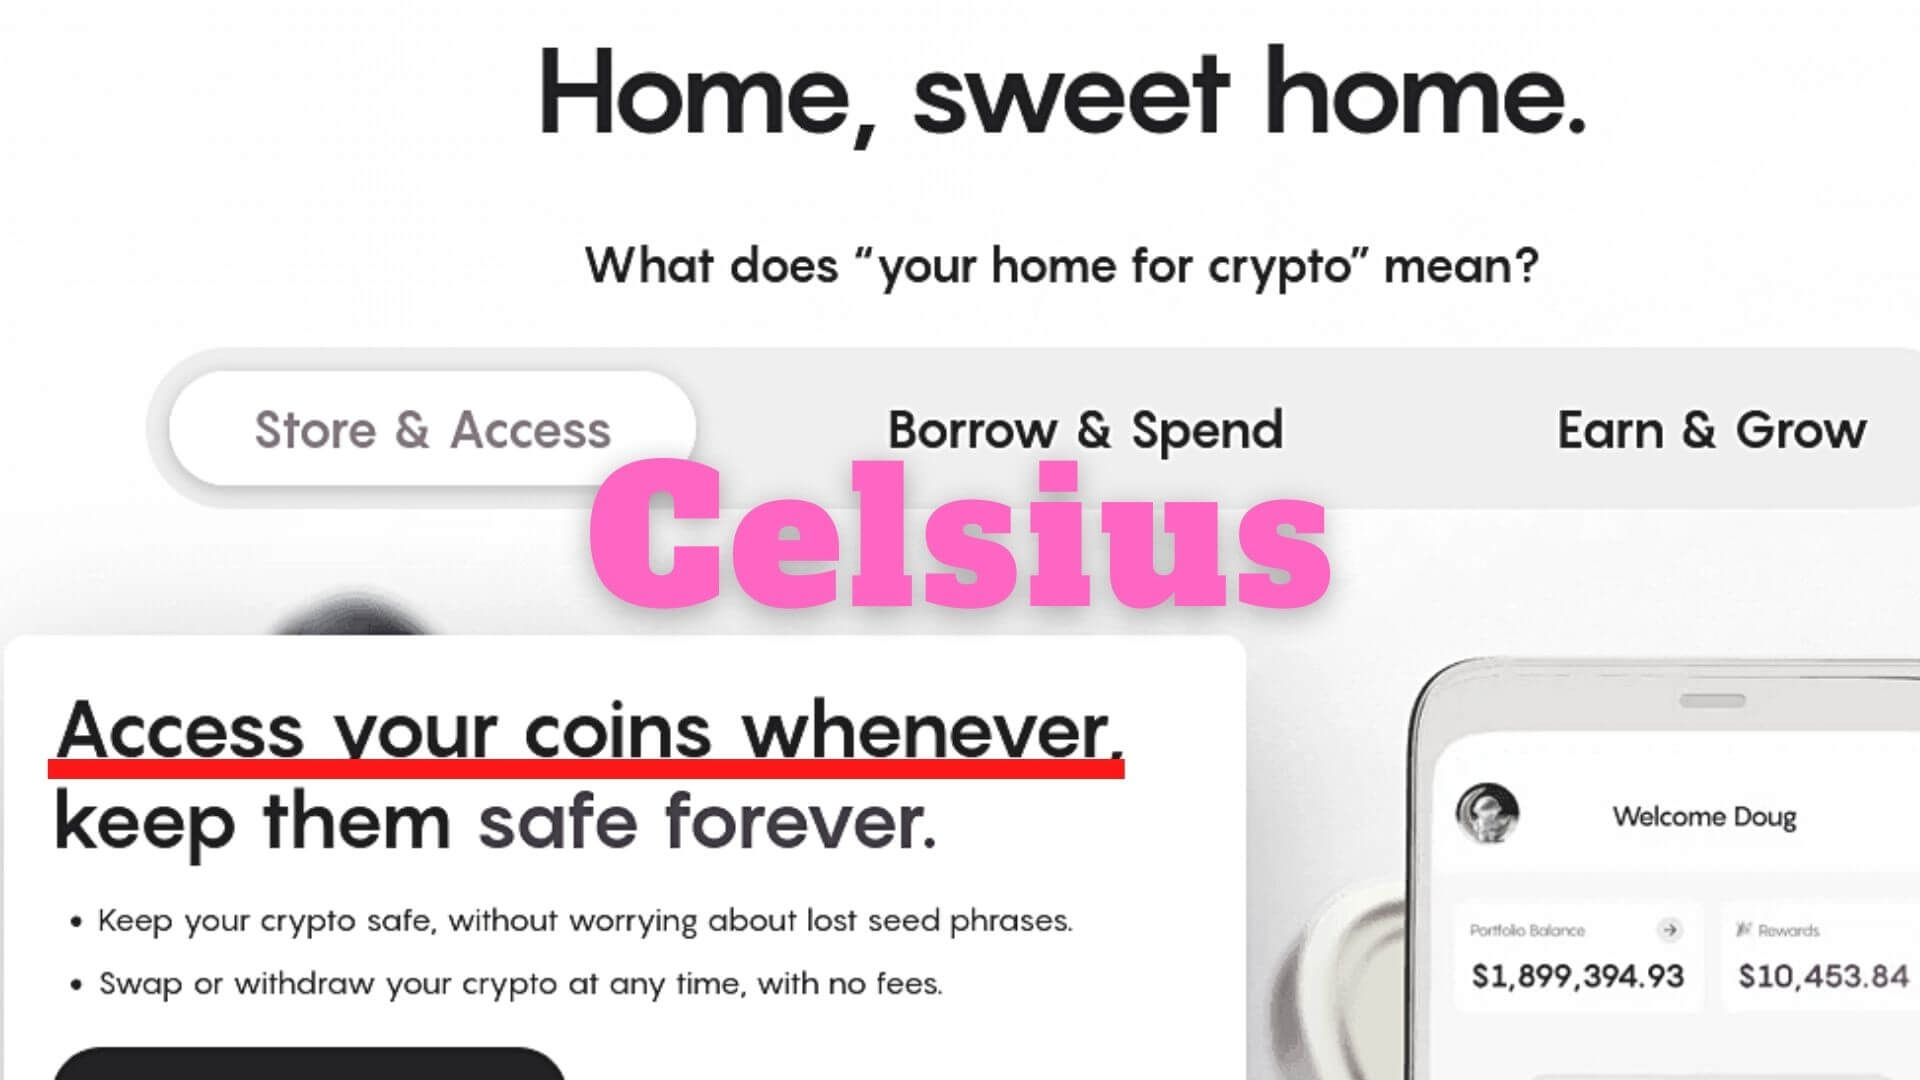
On a side note, I find it ironic that even to this day, the Celsius website is still showing banners like this:

Portfolio Performance
The portfolio reached a new low in June. At the beginning of the month, the total value was $53.96. However, today on the last day of the month, the total value is $38.75. This is a 28.19% drop, month-to-month.

Overall, the portfolio is down over 70% since its creation. Since some coins lost more than others, here is the same chart, but split into individual coins, and expressed in terms of percentages:

The one at zero is LUNA (actually WLUNA) because of the collapse I covered last month.
Performance By Coin
I also wanted to look at which coins have lost the most money. When I created the portfolio, I did it under the assumption that the bigger coins would hold their value better, while smaller ones would fluctuate more wildly. This table shows the results:

In this case, I cannot see a meaningful relationship between the size and the drop. BTC and BNB certainly held their value better than any other coin, and they were one of the biggest at first. However, ETH and LUNA were also in my top 5 at the beginning, and they became big losers. The one at the bottom is WLUNA / LUNA, which should be 100% down, basically.
Correlation With The Stock Market
I have been covering this aspect since at least last month. Not much has changed, except that the correlation between the coins in the portfolio and the stock market is even stronger. For the record, I’m using VTI (Vanguard Total Stock Market Index Fund ETF) as the “stock market” here.

The correlation between VTI and all other coins increased. Last month, there was a 0.88 correlation between VTI and BTC. Today, that correlation score is 0.93.
New Allocation Percentages
Bitcoin dominance dropped slightly from 18% a month ago to 15.13%. There were more changes to other coins:

The top 5 coins did not change, with the exception of DOGE and DOT swapping positions.
I also like plotting the current allocation as a pie chart, since it shows more clearly how diversified the portfolio is.

As you can see, the top 10 coins increased their dominance over the portfolio. Currently, the top 5 coins make up 54% of the value. The top 10 coins combined make up 77.57% of the value, and the bottom 10 make up the remaining 22.43%.
Summary Info
- Monthly Portfolio Performance (June 1st – June 30th)

Even though the portfolio lost over 28% this month, it is still less than the drop in May, when it lost almost 37%.
- Total Portfolio Performance Since Inception

This portfolio has lost almost 75% of its value since it was created. I would say that it has not been a great investment so far.
Final Thoughts
We will see what the markets do in July. I have no idea which direction crypto will go, but I would imagine that it is still too risky. Interest rates will continue to rise and investors might want to go to more stable assets.
Additionally, now that Celsius paused crypto withdrawals, I want to see how that plays out. It will surely put more pressure on US regulators to crack down on the sector. I also hope that Celsius actually returns its customers’ assets in a timely manner.
If you want to run the Python code I used for this post, check my Github repository.
Let me know in the comments if there is anything I left out or that I should look at. Finally, don’t forget to join the newsletter mailing list to be notified when I post new things.